How to read cryptocurrency charts: A beginner’s guide
Dec 8, 2025・10 min read
Crypto charts are less complicated than their constantly changing colored lines and blinking numbers make them appear. They report data – sometimes moment-by-moment – on how many people are buying a given cryptocurrency and what it’s worth. Some are more detailed than others, but once you learn how to read cryptocurrency charts, there’s a strong chance you’ll start to notice patterns and even be able to estimate price movements with confidence.
This guide will help beginners understand how to read cryptocurrency charts, how different charts work, and how to read market signals that support a robust trading strategy.
Analyzing crypto charts: Key concepts and indicators
Before reading cryptocurrency charts, it’s important to understand what they highlight – and how they provide visuals into crypto trading at large. Here are some of the major terms and figures you’ll find on a crypto chart:
- Market capitalization: This indicator, also known as market cap, shows a cryptocurrency’s total value. It’s calculated by multiplying the coin’s current price by the number of coins in circulation.
- Time frame: Change this setting in a chart to track price movements over a set amount of time. A one-minute chart captures fast movements, while a one-day chart helps you spot longer-term trends.
- Trading pair: Compare one coin to another – like Bitcoin (BTC) to Tether (USDT) – with this setting. Trading pair information tells you how much one asset is worth in the other currency.
- Current, high, and low prices: These numbers show you where the price is now, how high it went, and how low it dropped in the period you selected as a time frame.
- 24-hour volume: This figure is based on the total value of a given coin (how frequently it was bought and sold) in the past 24 hours. It’s a key indicator of liquidity and reveals which currencies have caught traders’ attention.
- Support and resistance: Consider support and resistance the key price levels for the coin you’re tracking. Support is like a floor, where the price stabilizes and most buyers enter. Resistance is like a ceiling, where coins face selling pressure and most sellers tend to step in.
- Simple moving average (SMA): The SMA smooths out price data over a specific period to provide a clearer view of trends. For example, if Ethereum (ETH) is priced at $3,500, $3,400, and $3,600 over three days, the SMA averages these prices to offer a single data point ($3,500) that simplifies trend analysis.
- Relative strength index (RSI): This indicator measures the speed and change of price movements, then scores them on a scale from zero to 100. If the RSI is above 70, the coin is most likely overbought; if it’s below 30, it might be oversold. High and low RSIs can also indicate price reversals.
2025
Crypto Tax
Guide is here
CoinTracker's definitive guide to Bitcoin & crypto taxes provides everything you need to know to file your 2024 crypto taxes accurately.

What are the most popular crypto charts?
When you open a crypto exchange like Kraken or a tracking site like CoinMarketCap, you’ll likely see charts tracking a coin’s price over time. But not every crypto chart looks the same. The three most common are candlestick charts, volume charts, and line charts, and each style tells the same price story in its own way.
Here’s a breakdown of how to analyze these crypto charts.
What are line charts?
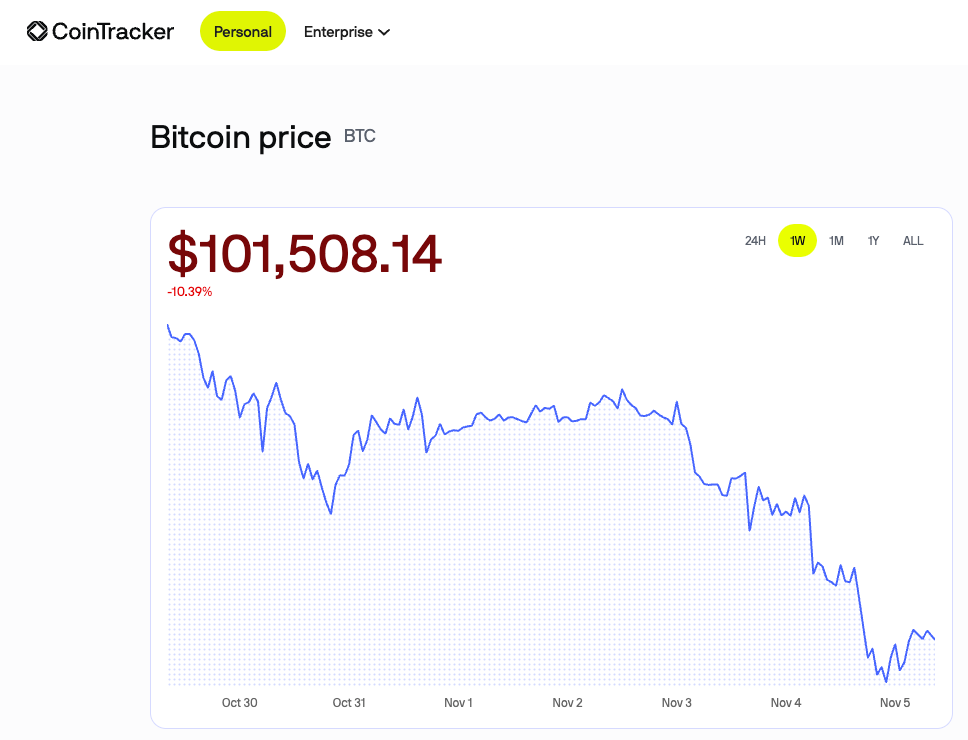
Line charts are the simplest way to visualize cryptocurrency prices. A line chart connects the closing prices of each time period with a continuous line. This creates a curve that shows how the price moves. Depending on the scale, some line charts look very jagged as they map smaller price fluctuations, while others look at big-picture shifts in price.
Because line charts only show closing prices and not other measurements, they’re great for beginners and long-term investors who want to see the price’s direction before buying crypto.

Source: CoinTracker
Alt text: CoinTracker’s BTC price page with a Bitcoin line chart displaying one week of movement.
How to read line charts
Each point on a line chart shows the coin’s closing price for a given time frame. They’re connected by a line to show the general direction a cryptocurrency’s price is moving.
- When the line slopes upward, prices are increasing.
- When the line slopes downward, prices are decreasing.
- A flat line means a steady market with little change.
Line chart trends and patterns
Even though line charts don’t offer many details, they can still reveal useful patterns and trend signals.
Uptrend and downtrend
Visually, upward and downward trends are easy to spot. An uptrend is a series of higher highs and higher lows. This means the buyers are pushing the price higher. A downtrend is the opposite: It shows lower highs and lower lows that signal a growing pressure to sell.
Price channel
Imagine yourself throwing a bouncy ball down a covered slide. The ball might bounce and hit the top and bottom of the slide, or it might roll straight down, but it stays inside the slide the whole way down. That’s also how a price channel works.
In a line chart, a price channel comes from two straight, parallel lines: resistance (ceiling) and support (floor). Support is where many buyers enter, often seen with a spike in volume. Resistance is where heavy selling happens, also marked by high volume. The price of a given coin ascends, descends, or stays consistent between those two lines.
Generally, traders will use a price channel to determine when to buy (when the price nears the resistance line) or sell (when the price nears the support line). But when the price finally breaks out of those parallel lines, it can mark the start of a new trend.
What are candlestick charts?
Candlestick charts originated in 18th-century Japan and remain one of the most popular ways to view asset prices (including crypto) to this day. Each colored rectangle, or candle, on the chart reveals how the price moved within a given time frame. Generally, candlestick charts show data by the minute, hour, or day.
The same technical analysis that earned rice merchant Munehisa Homma billions (in today’s standards) still works for crypto day traders now. Every candle is a visual representation of how buying and selling went for a given interval. When you line them up, they reveal the opening, closing, high, and low prices – and, consequently, how traders felt about their crypto investment.
Candlestick charts are information-rich, easy to read, and great for spotting trends. These charts are also ideal for measuring turning points that rely on market sentiment and traders’ mindsets rather than just supply and demand. If a day opened high and closed much lower, for example, a candlestick chart could show a high sales volume, which increases the pressure to short.

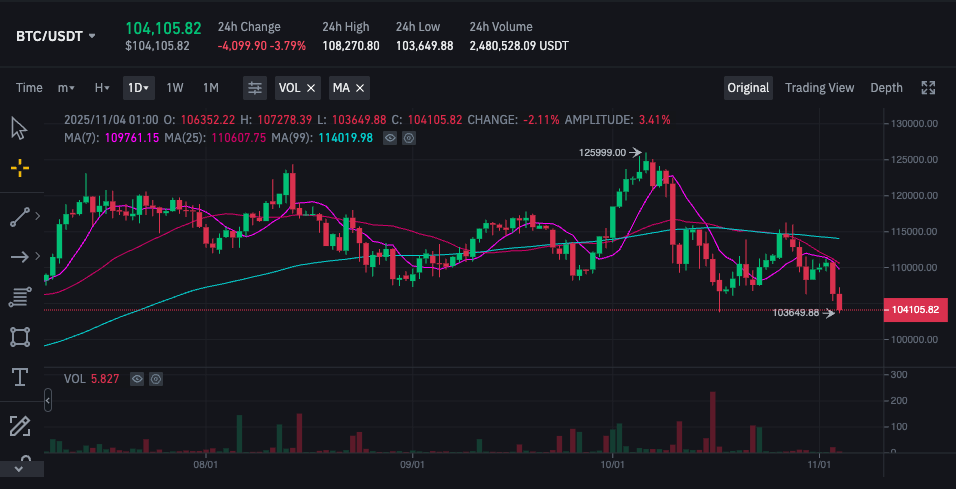
Source: Binance
Alt text: Binance’s BTC/USDC spot trade page with a candlestick chart of Bitcoin’s one-day movements in the middle.
How to read candlestick charts
Each candle in the chart has three main parts: the body and two wicks (sometimes called shadows). The body is the colored center of each candle, representing the closing and opening prices for a given time frame. Wicks identify the highest and lowest prices reached in that time, represented by an upper and lower line extending on either side of the body like a box plot.
The color of the candle also lets you quickly identify price direction:
- Green candle: The price closed higher than it opened.
- Red candle: The price closed lower than it opened.
For example, if the BTC you’re tracking opened at $103,800 and closed at $104,500, the candle would be green because buyers pushed the price higher. If it opened at $104,900 and closed at $103,800, the candle would be red because more people sold, lowering the value. The wicks mark the highest and the lowest prices reached during that day.
Candlestick trends and patterns
Certain candle shapes repeat over time, mapping predictable changes in trading behavior. These repetitions are called candlestick chart patterns.
Candlestick patterns can signal when the momentum is changing, such as when buyers start to lose strength (and prices stabilize or dip) or when sellers are about to retreat (and prices stabilize or rise). These patterns highlight early hints of reversals or trend continuations. There are two main types of reversal patterns: bullish (increasing prices) and bearish (decreasing prices).
Bullish reversal patterns
Bullish reversal patterns often appear after a price drop. They suggest that buyers are purchasing more of a given cryptocurrency and that prices may soon go up again. Here are three types of bullish reversal patterns in a candlestick chart:
- Hammer: A hammer candle has a small body near the top and a long lower wick. It shows that sellers pushed the price down, but buyers quickly brought it back up. Hammer candles can signal a future price bounce, and can be either red or green.
- Bullish engulfing: An engulfing pattern forms when a cryptocurrency has a lower opening and higher closing price than the previous period’s higher opening and lower closing. Visually, this results in a large green candle that follows and completely covers a red one. It signals that buyers have overpowered sellers and a trend reversal is probably starting.
- Morning star: The morning star is a three-candle pattern that often appears at the lowest point of a downtrend. The first candle is large and red, showing strong selling. The second is small, showing indecision. The third candle is a large green one that closes well into the first candle’s body, showing that buyers have started investing in the currency at higher volumes than sellers.
Bearish reversal patterns
Bearish patterns warn that there may be more people selling, or selling larger quantities, of the currency, and prices could fall. Here are three types of bearish reversal patterns commonly found in candlestick charts:
- Shooting star: This candle pattern has a small body and a long upper wick. It means buyers tried to push prices higher but failed to hold the gains, showing weakening momentum. Shooting stars can be red or green.
- Bearish engulfing: As the opposite of bullish engulfing, this pattern has a higher opening and lower closing price than the previous period’s lower opening and higher closing. Visually, this looks like a red candle that completely covers the smaller green one before it. This usually means the selling pressure is increasing, and a downtrend could follow.
- Evening star: The evening star is an inversion of the morning star – it’s another three-candle pattern that appears at the top of an uptrend. The first candle is large and green, the second is small (signaling hesitation), and the third is red and closes into the first candle’s body. It suggests sellers are starting to outpace buyers for a given currency.
What are volume charts?
Now that we’ve laid out the basics of how to read a crypto chart with candles and lines, we can add another layer: volume charts.
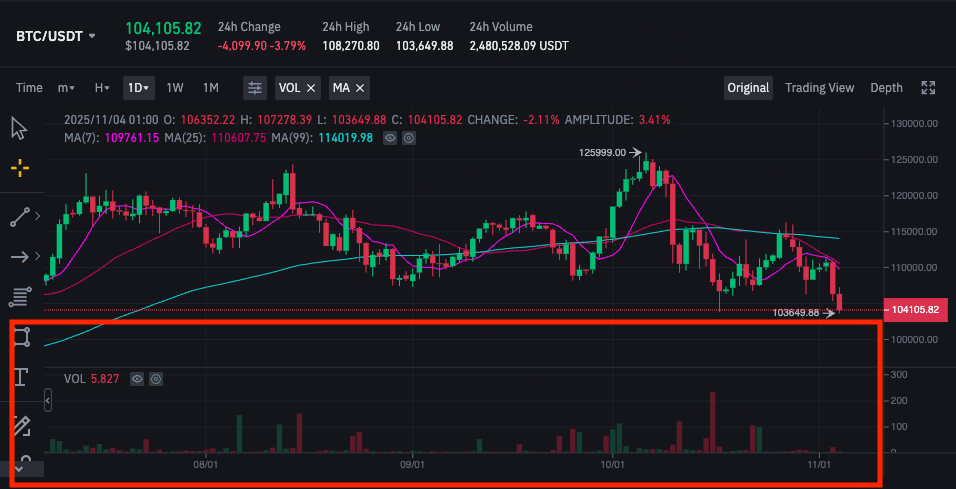
The volume axis on a chart, often represented as a bar graph, shows you how much of a given cryptocurrency has been traded over a set period. Each vertical bar represents the total number of coins bought and sold during that time frame. In the image below, the volume chart is the bar graph below the candlestick chart.

Source: Binance
Alt text: Binance’s BTC/USDC spot trade page, with one-day movements of the Bitcoin candle chart in the middle and volume chart highlighted by a red box at the bottom.
How to read volume charts
Trading volume provides more information about a price chart than just prices. When you see tall bars, more traders are active, and smaller bars mean fewer traders. A green volume bar means most trades happened while the price was going up. Red bars mean most trades happened during a price drop.
Volume can also help you find price channels, or support and resistance.
To read a volume chart, compare how volume changes with price:
- Rising prices + increasing volume = Large green bar = Strong buying pressure
- Rising prices + low volume = Small green bar = Weak upward trend, may not last
- Falling prices + increasing volume = Large red bar = Strong selling pressure
- Falling prices + low volume = Small red bar = Weak downtrend or market exhaustion
Volume chart trends and patterns
Volume doesn’t create patterns, but it confirms the strength of price patterns that appear on candlestick or line charts. When you see familiar shapes like stars or a hammer, checking for volume patterns (like the ones below) can tell you if the price is staying consistent or fading.
Triangle pattern
In this pattern, resistance and support lines get closer together (creating higher lows and lower highs, or vice versa), narrowing the price channel to create a triangle. Volume usually drops during this “squeeze,” then rises sharply when the price breaks out.
Head and shoulders
This reversal pattern resembles three mountains, with two smaller and a taller in the middle, or a head and shoulders. Often, volume peaks on the left shoulder and head, then fades on the right. This indicates weakening momentum and dropping prices.
Double bottom
Two low points on the price chart form a “W” shape in a double bottom pattern. Volume tends to increase on the second bottom, usually confirming that buyers are back and the rise in price is likely to continue.
Double top
Similar to a head and shoulders, and inverse to a double bottom pattern, a double top pattern forms an “M” with two high points. Volume often drops on the second high point, suggesting that buying pressure is fading and a reversal may follow.
When to use each type of chart
The best type of crypto chart depends on how you use it. If you want a quick overview of the crypto market trends and prices, go for a simple line chart. And if you want to study price behavior in more detail and spot potential reversals, try candlestick charts paired with volume charts.
Simplify your crypto taxes with CoinTracker
Whether you’re analyzing charts or executing trades, it’s important to keep track of how prices change. Not only can it affect how much you gain or lose, but you’ll need to report every crypto event come tax season. CoinTracker helps you seamlessly manage your crypto taxes by syncing with hundreds of wallets and major exchanges to automatically track every transaction for you.
Ready to take your crypto portfolio to the next level? Start making informed decisions with our expert guides.
Disclaimer: This post is informational only and is not intended as tax advice. For tax advice, please consult a tax professional.